FINANCIAL DISTRESS
Financial Distress
YES
Audit Outcome
QUALIFIED
Score Summary
6
Ind 1 to 13
2
Ind 12 and 13
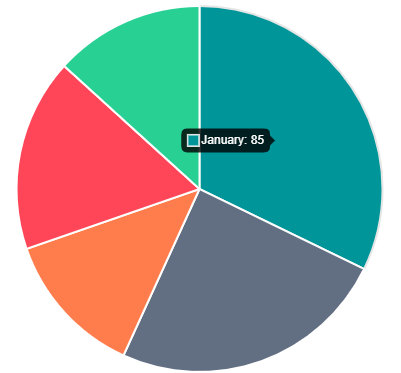
Financial Indicators
| 1. Cash/cash equivalent position | R 1 171 632 915 |
| 2. Cash plus investments less applications | R 792 652 551 |
| 3. Cash Coverage | 2.06 |
| 4. Repairs and maintenance expenditure level | 1.79% |
| 5. Asset renewal/ rehabilitation expenditure level | 32.76% |
| 6. Asset renewal/ Depreciation level | 44.47% |
| 7. Total CAPEX as Percentage of Total Expenditure | 20.45% |
| 8. Liquidity Ratio | 0.68 |
| 9. Debtors Days | 86.31 |
| 10. Creditors Days | 81.09 |
| 11. Debt (Total Borrowing) vs Total Operating Revenue | 5.62% |
| 12. Current Ratio | 1.61 |
| 13. Solvency Ratio | 8.76 |
BUDGET
Tabled Budget
FUNDED
Adopted Budget
UNFUNDED
Adjusted Budget
N/A
Funded Plan Available
Plan Approval (NT/PT)
Cashflow includes Surplus
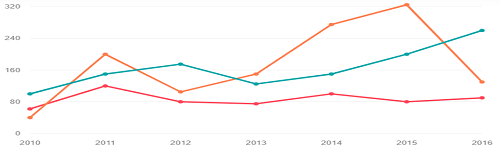
5 Years Budget Trend
DEBTS TO SUPPLIERS
Eskom
Total Due
R 260 307
Section 41
R 225 789
Section 71
R 34 518
Variance
R 207 931
Overdue
| Sales | R 471 860 |
| Payment | R 392 662 |
| NMD | R 0 |
| Total Interest | R 1 722 |
Trend Analysis
Waterboards
Total Due
R 160 789
Section 41
R 150 789
Section 71
R 10 000
Variance
Total Due by Months
Others
PAYE deductions
R 471 861
VAT
R 392 663
Pensions/Retirement
R 0
Loan repayments
R 1 722
Trade Creditors
R 471 861
Auditor-General
R 392 663
Other
R 0
CUSTOMER GROUP DEBTORS
R 1 220 143 171
Organs of State
R 8 544 270 796
Commercial
R 10 852 105 785
Households
R 19 432 894
Other
Total Due